rsudp.c_plot (plot data)
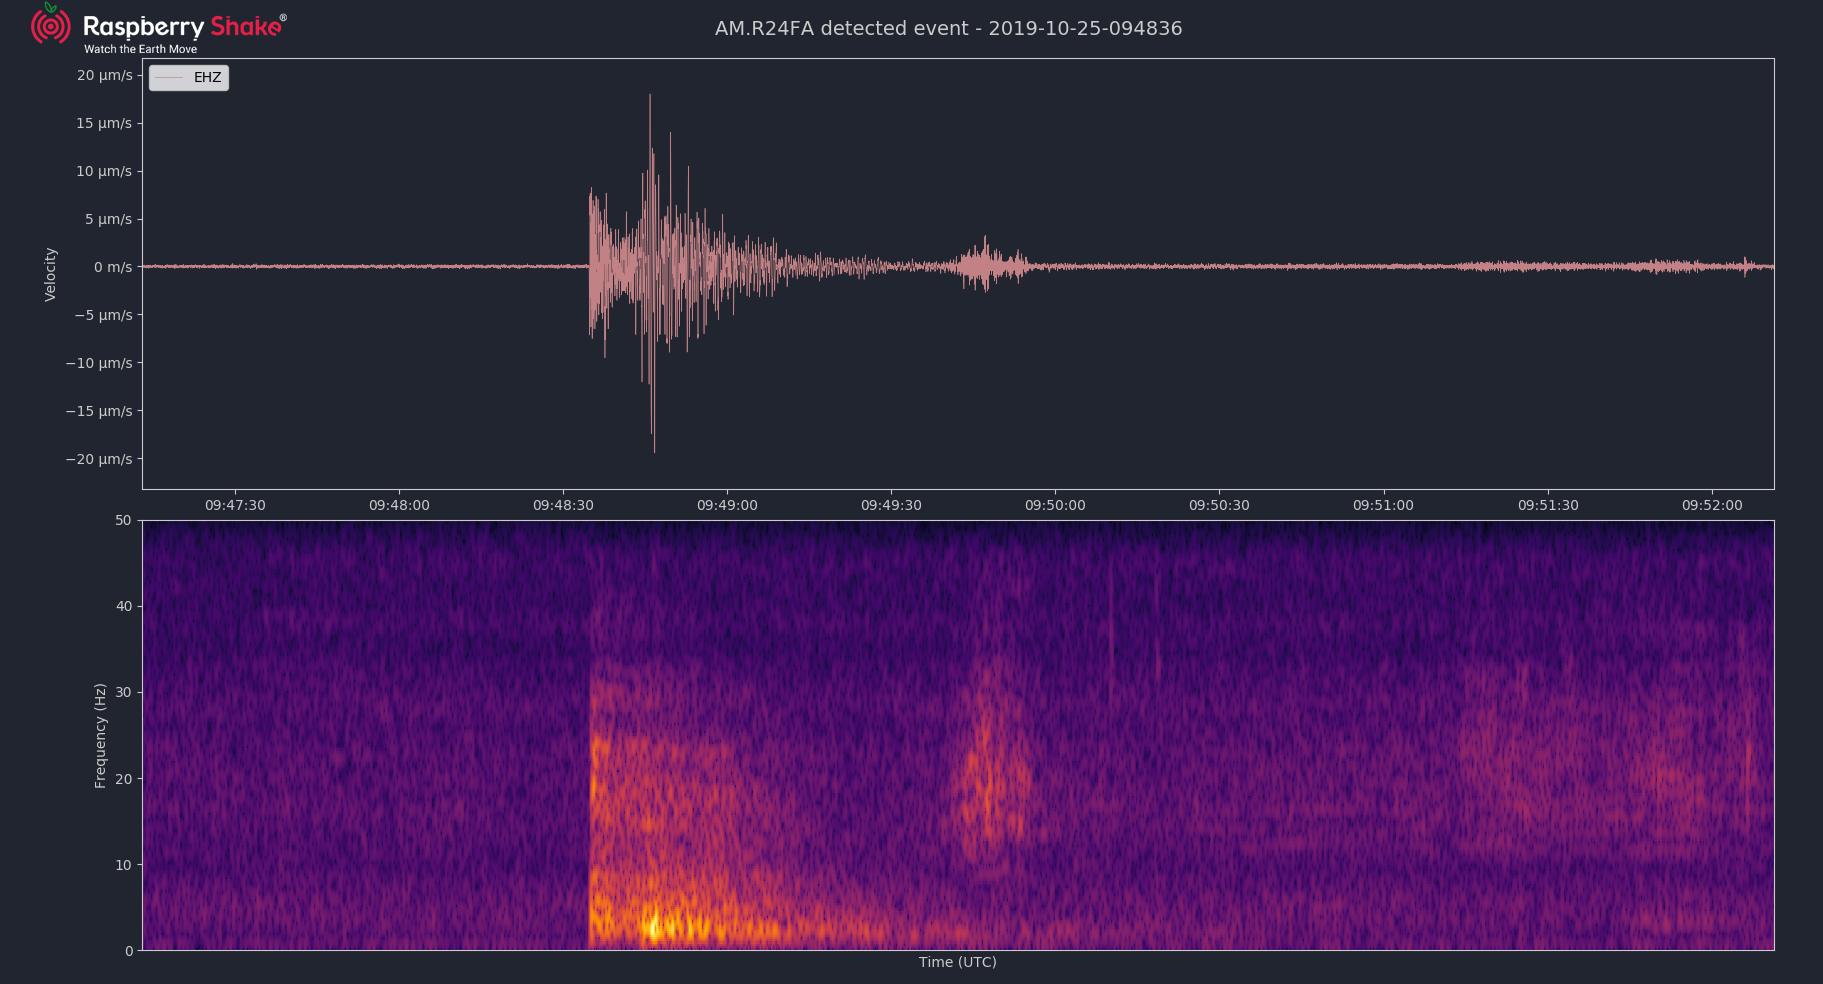
An event recorded on a vertical geophone by rsudp and saved by the plotting module.
- class rsudp.c_plot.Plot(q, cha='all', refresh_interval=0, seconds=30, spectrogram=True, fullscreen=False, kiosk=False, deconv=False, screencap=False, alert=True, filter_waveform=False, spectrogram_freq_range=False, upper_limit=50.0, lower_limit=0.0, logarithmic_y_axis=False, filter_spectrogram=False, filter_highpass=0, filter_lowpass=45, filter_corners=4, testing=False)
GUI plotting algorithm, compatible with both Qt5 and TkAgg backends (see
matplotlib.use()). This module can plot seismogram data from a list of 1-4 Shake channels, and calculate and display a spectrogram beneath each.By default the plotted
"duration"in seconds is30. The plot will refresh at most once per second, but slower processors may take longer. The longer the duration, the more processor power it will take to refresh the plot, especially when the spectrogram is enabled. To disable the spectrogram, set"spectrogram"tofalsein the settings file. To put the plot into fullscreen window mode, set"fullscreen"totrue. To put the plot into kiosk mode, set"kiosk"totrue.- Parameters:
iterations without delay will be counted. Defaults to 0. :param bool spectrogram: whether to plot the spectrogram. Defaults to True. :param bool fullscreen: whether to plot in a fullscreen window. Defaults to False. :param bool kiosk: whether to plot in kiosk mode (true fullscreen). Defaults to False. :param deconv: whether to deconvolve the signal. Defaults to False. :type deconv: str or bool :param bool screencap: whether or not to save screenshots of events. Defaults to False. :param bool alert: whether to draw the number of events at startup. Defaults to True. :param queue.Queue q: queue of data and messages sent by
rsudp.c_consumer.Consumer:raise ImportError: if the module cannot import either of the Matplotlib Qt5 or TkAgg backends- deconvolve()
Send the streams to the central library deconvolve function.
- figloop()
Let some time elapse in order for the plot canvas to draw properly. Must be separate from
update_plot()to avoid a broadcast error early in plotting.
- getq()
Get data from the queue and test for whether it has certain strings. ALARM and TERM both trigger specific behavior. ALARM messages cause the event counter to increment, and if
screencap==Truethen aplot image will be saved when the event isself.save_pctof the way across the plot.
- handle_close(evt)
Handles a plot close event. This will trigger a full shutdown of all other processes related to rsudp.
- handle_resize(evt=False)
Handles a plot window resize event. This will allow the plot to resize dynamically.
- mainloop(i, u)
The main loop in the
rsudp.c_plot.Plot.run().
- qu(u)
Get a queue object and increment the queue counter. This is a way to figure out how many channels have arrived in the queue.
- run()
The heart of the plotting routine.
Begins by updating the queue to populate a
obspy.core.stream.Streamobject, then setting up the main plot. The first time through the main loop, the plot is not drawn. After that, the plot is drawn every time all channels are updated. Any plots containing a spectrogram and more than 1 channel are drawn at most every second (1000 ms). All other plots are drawn at most every quarter second (250 ms).
- savefig(event_time=UTCDateTime(2025, 1, 12, 19, 54, 11, 885101), event_time_str='2025-01-12-195411')
Saves the figure and puts an IMGPATH message on the master queue. This message can be used to upload the image to various services.
- Parameters:
event_time (obspy.core.utcdatetime.UTCDateTime) – Event time as an obspy UTCDateTime object. Defaults to
UTCDateTime.now().event_time_str (str) – Event time as a string, in the format
'%Y-%m-%d-%H%M%S'. This is used to set the filename.
- set_sps()
Get samples per second from the main library.
- setup_plot()
Sets up the plot. Quite a lot of stuff happens in this function. Matplotlib backends are not threadsafe, so things are a little weird. See code comments for details.
- update_plot()
Redraw the plot with new data. Called on every nth loop after the plot is set up, where n is the number of channels times the data packet arrival rate in Hz. This has the effect of making the plot update once per second.